Executive Summary
Everyone Says VR Is Intense. We Measured It.
Context
Sequence: Internal R&D
Timeline
December 2016
Project
VR vs. 2D biometric comparison study
My Role
Study Designer & Facilitator
The Problem
- “VR is intense” was the industry’s consensus claim in 2016: repeated everywhere, quantified nowhere
- Every account of how VR felt came from self-reported impressions, which are subjective, socially influenced, and impossible to compare across people
Outcome
- Ran a controlled 14-subject study using Senstream’s biosensing platform to record physiological response to the same racing game played on a normal screen and in a VR headset
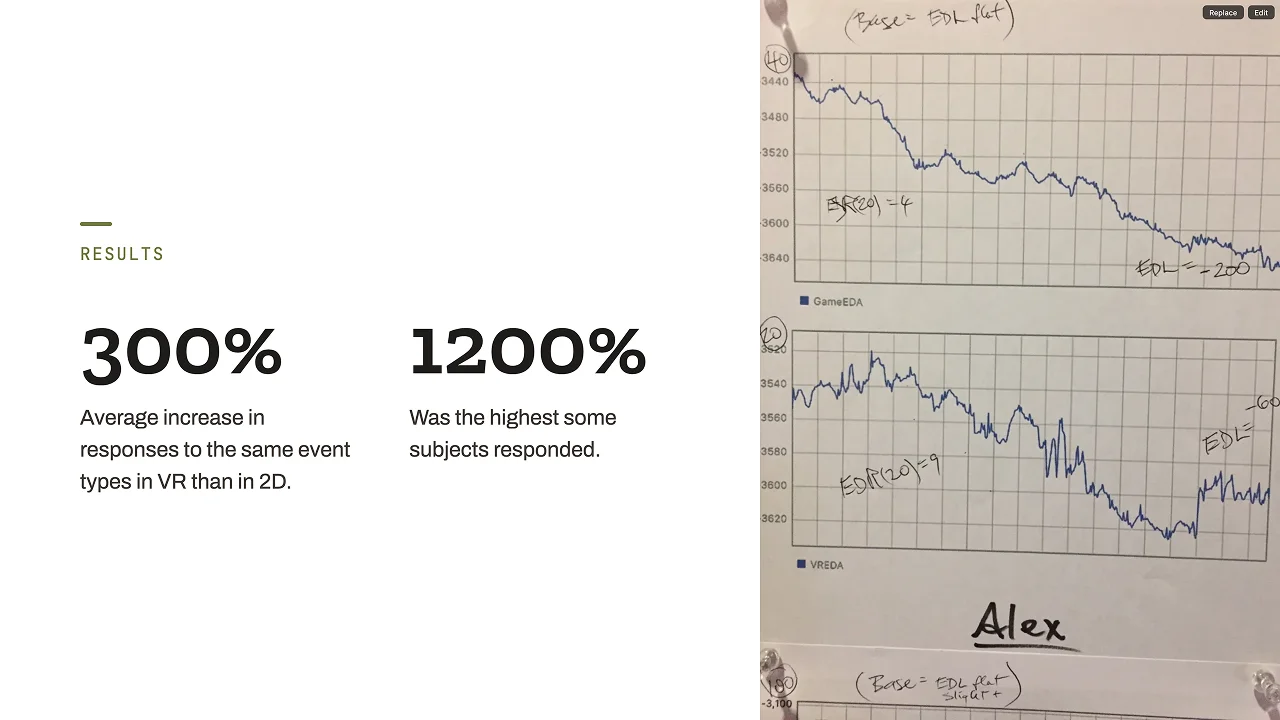
- Measured an average 300% higher physiological response to the same event types in VR than in 2D, with the most reactive subjects running up to 1200% higher
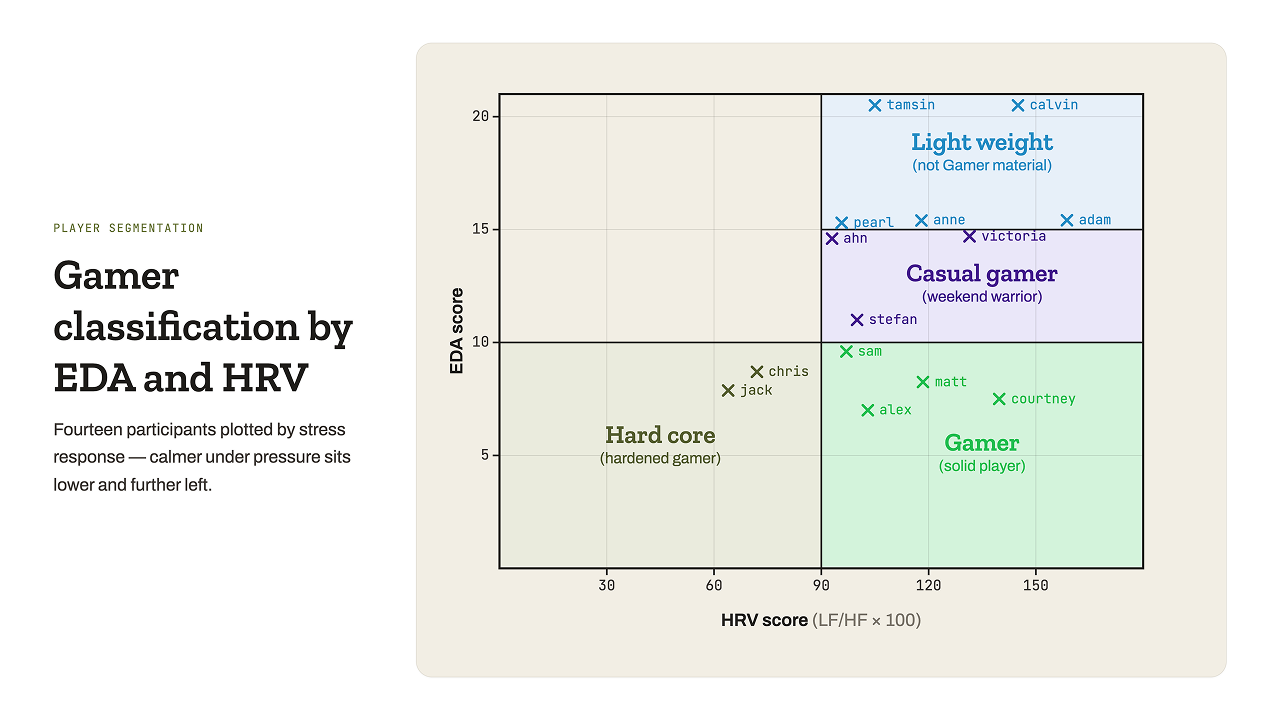
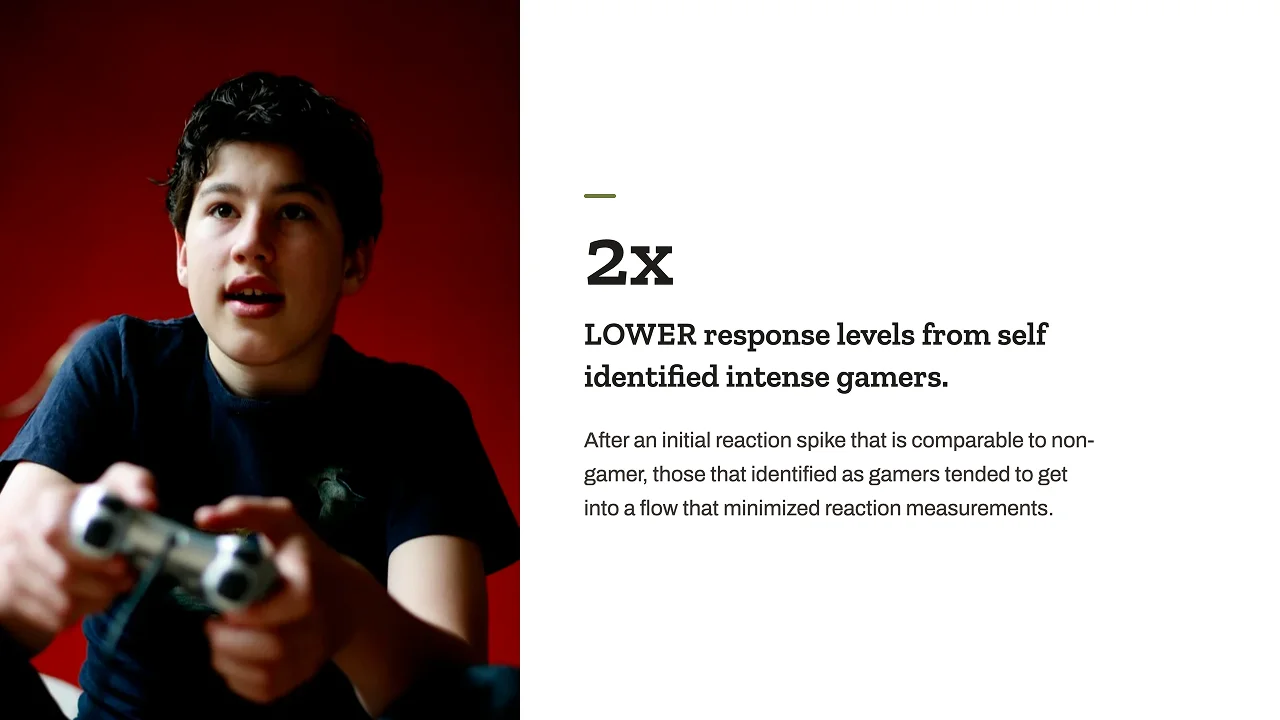
- Found a sharp split by player type: self-identified intense gamers registered response levels roughly 2x lower than non-gamers to the same content
My Role
- Shaped the study question and comparison methodology
- Repurposed the existing Senstream capture app to run the three-phase protocol
- Ran test sessions and synthesized findings into a shareable POV
Detailed Case Study
Context and Challenge
Why This Problem Mattered
What was not working
VR was being designed on instinct and anecdote (“it feels more immersive”), with no measured baseline for how much more intense the experience was.
Why it was hard
Self-perception is unreliable. People under-report discomfort, over-report novelty, and cannot compare their own arousal across two sessions
Strategic risk
Designing VR experiences without knowing the intensity baseline risks overwhelming users, or under-using the medium’s one genuine advantage
Why Senstream Was the Right Instrument
Quantifying Feeling
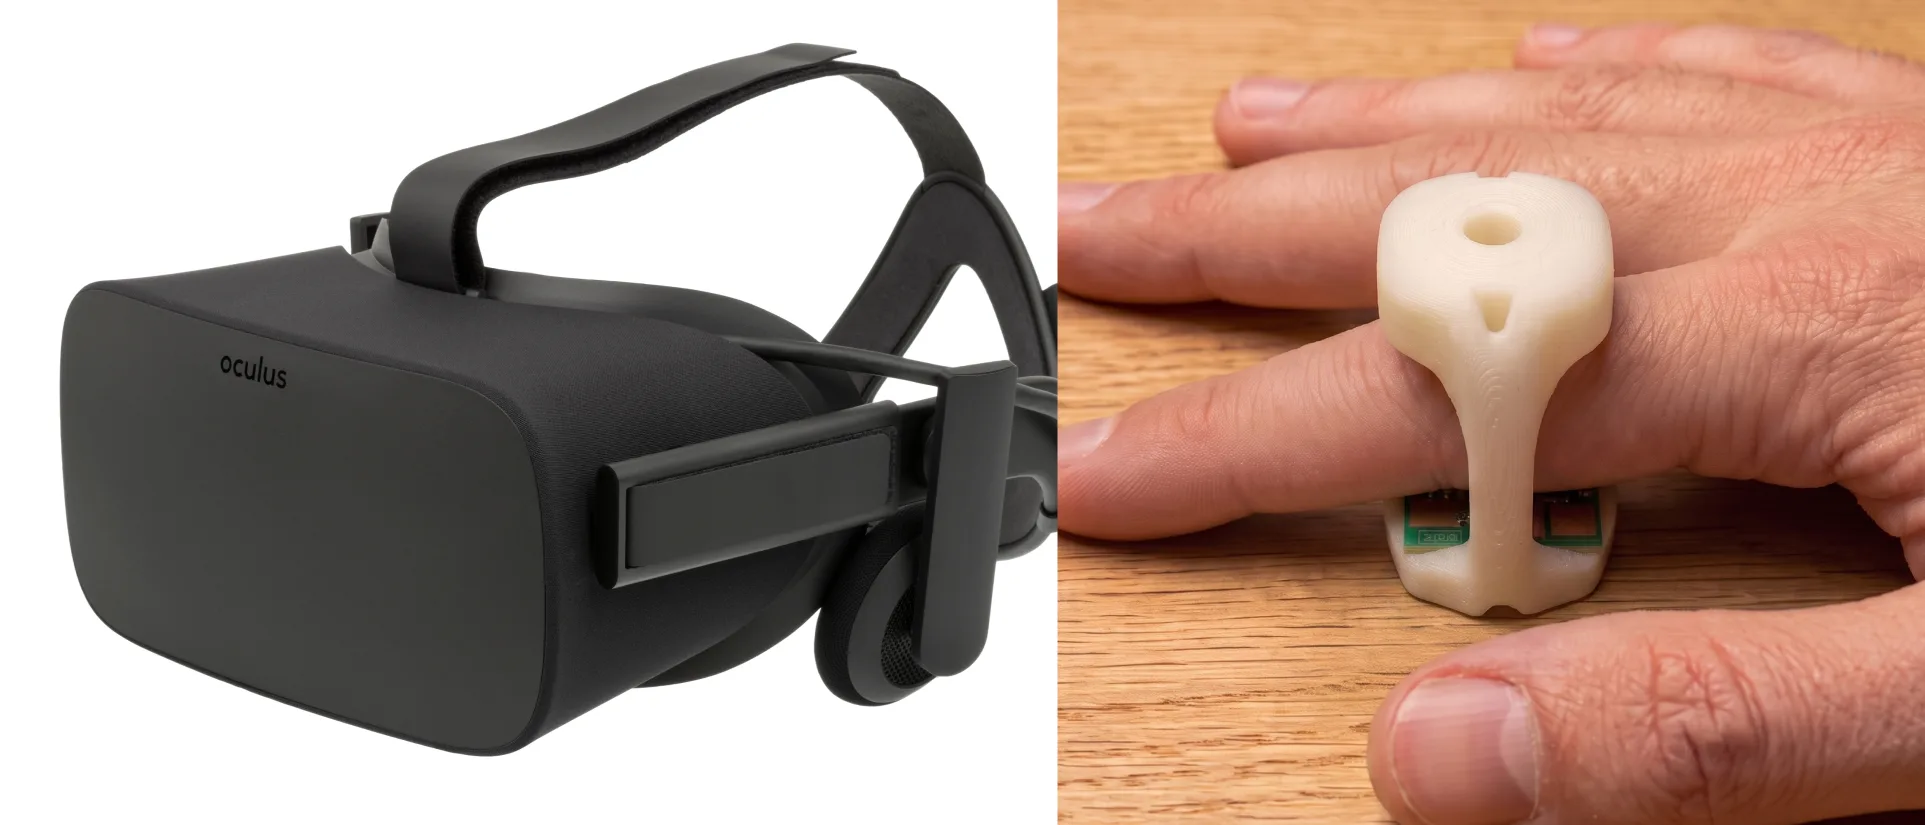
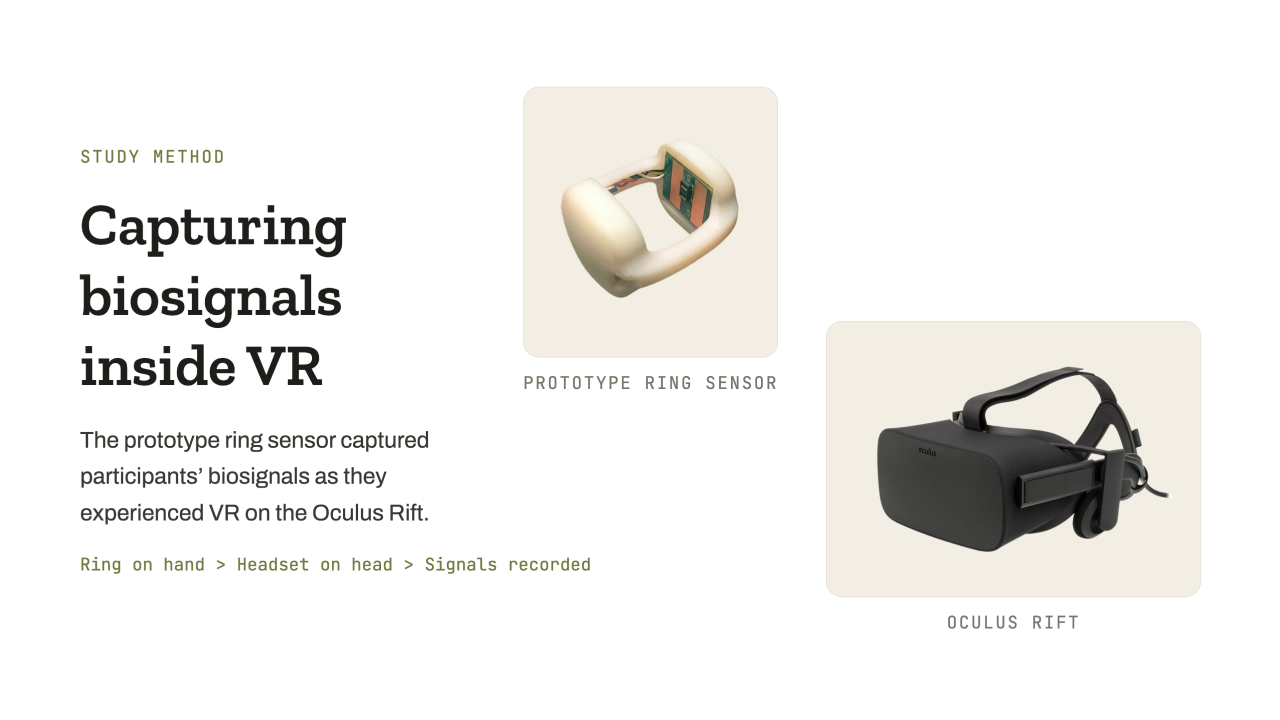
Senstream’s core capability is turning biosignal (captured here by a prototype ring sensor worn on the hand) into a continuous, moment-by-moment measure of response, removing the subjectivity of self-perception
Within-Subject Comparison
Because each person served as their own control, the 2D-versus-VR difference could be read directly, without normalizing across bodies
Continuous, Not Summary
A time-series signal shows which moments spike, not only whether the session felt intense overall.
Constraints and Complexities
Skunkworks Budget
Internal R&D with no client funding: the whole study had to be prepared and run in roughly two days of working time
Isolating the Variable
The only thing allowed to change between conditions was the display medium: same game, same subject, same room, same session
Improvised Lab
Testing ran in the back of the studio rather than a controlled research facility, so the protocol had to tolerate a noisy real-world environment
Approach & Execution
The Comparison Test
We built the study as a within-subject comparison: record a resting baseline, have the subject play a racing game in the traditional “2D” way on a monitor, then hand them an Oculus headset and have them play the same game in VR. Biosignal was captured continuously across all three phases, so each subject’s VR response could be read against their own 2D response rather than against a population average.
Rather than build new tooling, we repurposed the capture app from a previous Senstream test, adding a simple three-button session flow (Record Baseline / 2D Game / VR Game) over a live dual-trace readout, so whoever was running the session could see the signal responding in real time and catch problems mid-test.
Test Logistics
14 Subjects
Deliberately mixed in gaming and technical sophistication, so player type could be read as a variable rather than a confound
6 Hours to Prepare
App repurposed from a prior test rather than built from scratch
9 Hours to Run
All sessions conducted in the back of the studio in a single push
The qualitative reactions tracked the signal. Across the sessions we logged “Whoa” nine times, “That was crazy” or “amazing” five times, and “I think I’m going to be sick” three times. The last group is the useful one: motion discomfort showed up in about one in five subjects on a short session, which is a design constraint, not a footnote.
Reading the Data
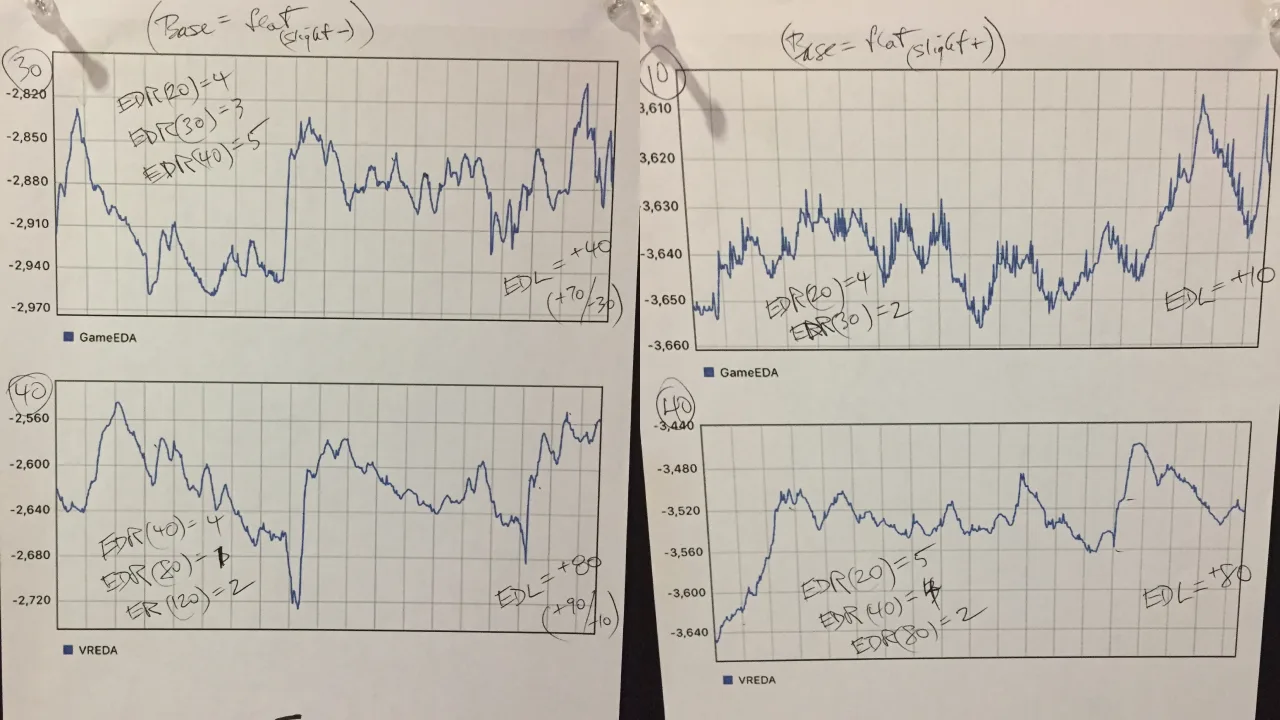
Analysis started literally on paper: printed EDA traces for each subject, annotated by hand with electrodermal response and level measurements, one sheet per person per condition. Comparing the marked-up VR sheet against the same subject’s 2D sheet made the magnitude of the difference visible before any of it was formally quantified.
Outcome & Influence
The headline finding was blunt: subjects reacted roughly 300% more strongly to the same event types in VR than they did to the identical game on a screen, with the most reactive subjects running as high as 1200%. “VR is intense” stopped being a figure of speech and became a number a designer could plan against.
The more interesting result was the split. Self-identified intense gamers registered response levels roughly 2x lower than non-gamers to the same content: they spiked on first contact like everyone else, then settled into a flow state the signal barely picked up. That means the audience most likely to be recruited for VR playtesting is also the audience least likely to register how intense the experience is for everyone else, with direct consequences for how VR content gets tested and tuned.
The study was run as skunkworks R&D with a specific downstream purpose: to give Sequence a novel, evidence-backed POV on VR to take into content marketing and client conversations, rather than repeating the industry’s received wisdom back at it.
What the Data Showed
Three findings came out of the analysis: where each subject sat once plotted by electrodermal activity (EDA) against heart-rate variability (HRV), how much harder the same content hit in VR, and the gap between gamers and everyone else.